

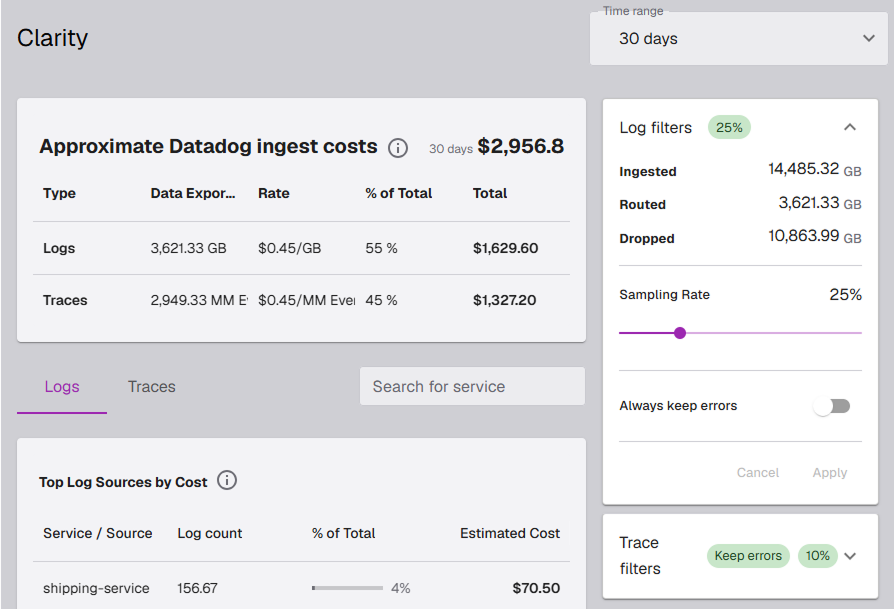
Octant Clarity, MyDecisive's new open-source tool, replaces hand-tuned OpenTelemetry sampling configs with a four-line, Git-managed policy that cuts routine log and trace volume while guaranteeing every error is kept and measurably tracked.
Octant Clarity: Delivering GitOps-enabled OpenTelemetry, in your cloud, in minutes
Telemetry volume is a constant struggle for DevOps teams. Percentage-based sampling — keeping a flat share of all logs and traces — is a simple way to control that volume, but it's also blind to context. A flat sampling rate will happily throw away failed requests, exceptions, and other signals you actually need when something breaks.
Octant Clarity, now open source, is built on the MyDecisive platform and shows how to turn a tangle of OpenTelemetry (OTel) Collector configuration into a simple, declarative, Git-managed policy. It separates two concerns that are usually tangled together: controlling the volume of routine logs and traces, and making sure errors are never dropped.
Instead of hand-editing OTel Collector YAML - parsing structured logs, mapping severity fields, tuning tail-sampling windows - operators write a short policy. Octant Clarity expands that policy into a full, source-controlled telemetry pipeline.
The Policy: Intent Over Implementation
At MyDecisive our approach to AI DevOps is driven by Intent Over Implementation. This is why we rely on Git as our source of truth, not proprietary runbooks.
Git captures fragments of OpenTelemetry, Kubernetes, or other configuration. Want to understand a policy or the "why" behind it? Simply view a policy as a collection of these fragments in a version-controlled, reviewable artifact.
Every change is a pull request backed by context, rationale, and a complete, dissectable history. Runbooks, by contrast, are the opposite. They are built up of many rules whose source is unknown. Runbooks only capture point-in-time implementation. They are static snapshots that start decaying the moment infrastructure changes. They drift silently, can't be diffed against reality, and force humans to improvise under pressure at 3 AM. Because runbooks encode implementation rather than intent, they have no mechanism for staying honest as systems evolve.
Git guarantees it. In essence runbooks are chained-together logic flows whereas our Git policies are composable functions that can be used by anyone in the enterprise (or enforced upon applications by central governance) without having to understand the entire flow in which they live.
With Octant Clarity, the desired state lives in Git, not in a runbook. The core policy is represented by four simple variables:
solution: clarity-example
environment: production
logs:
  ratio: 25
  persistErrors: true
traces:
  ratio: 10
  persistErrors: true
In plain terms, that's:
- Keep 25% of logs, but always keep error logs
- Keep 10% of traces, but always keep traces containing an error
That's the entire interface. Octant Clarity handles the signal-specific implementation behind it.
Enter GitOps as the Control Loop
Git stores the approved policy — it doesn't process any telemetry itself. Argo CD is what reads that policy and manages its lifecycle in Kubernetes.
Clarity defines an Argo CD Application in the mdai namespace with automatic sync turned off:
syncPolicy:
  automated:
    enabled: false
    prune: true
    selfHeal: false
This ensures Octant can manage the solution through controlled synchronization rather than bypassing Argo CD. Deployment order is managed via Argo CD sync waves, ensuring secrets and RBAC (sync-wave: "-1") are in place before the MyDecisive platform application and OTel collectors (sync-wave: "1") are applied.
This means changes only take effect through a controlled sync, not automatically. This means Octant stays in the one place actually driving deployment, rather than Argo CD syncing changes on its own.
Deployment order is handled with Argo CD sync waves: secrets and RBAC go in first (sync-wave: "-1"), then the MyDecisive platform and the OTel collectors follow (sync-wave: "1").
SmartHub: Translating Policy to Runtime Variables
SmartHub doesn't just install collectors; it dictates their behavior dynamically.
The MdaiHub custom resource is what converts the four policy values into environment variables the collectors actually read. It writes them into a generated ConfigMap:
spec:
  variables:
    - key: logs_ratio_number
      type: manual
      dataType: string
      default: "100"
      serializeAs:
        - name: LOGS_RATIO_NUMBER
    # (Repeated for logs_persist_errors, traces_ratio_number, traces_persist_errors)
Log Sampling Mechanics
Log sampling in Clarity happens in two stages: flag the errors first, then sample everything else. This is to capture logs in two stages – priority identification and probabilistic sampling.
Stage 1: Mark errors as high priority. A transform processor tags a record with sampling.priority = 100 whenever error persistence is turned on and the record looks like an error (by severity, status, or level):
transform/log_priority:
  error_mode: ignore
  log_statements:
    - context: log
      statements:
        - set(attributes["sampling.priority"], 100)
          where "${env:LOGS_PERSIST_ERRORS}" == "true"
          and (
            severity_number >= SEVERITY_NUMBER_ERROR
            or attributes["status"] == "Error"
            or attributes["level"] == "ERROR"
          )
Stage 2: Apply the configured ratio. It uses the normalized service attribute as its hash seed to ensure stable, service-aware sampling decisions. A probabilistic sampler then applies the ratio from SmartHub. It hashes on the service attribute so that sampling decisions stay stable and consistent per service:
probabilistic_sampler/logs:
  mode: hash_seed
  hash_seed: 22
  sampling_percentage: ${env:LOGS_RATIO_NUMBER}
  attribute_source: record
  from_attribute: service
  sampling_priority: sampling.priority
Trace Sampling Mechanics
Traces are different from logs because a trace is a connected chain of spans, not an independent record. If you sample individual spans on their own, you break that chain and end up with "orphaned spans;" effectively pieces of a trace with no context. So Clarity uses tail sampling instead of per-record sampling, deciding on the whole trace at once. With Clarity, you also don't need to scale your own tail-sampling engines — in-memory sharding handles that for you.
A load-balancing exporter routes all spans for a given trace, based on trace ID, to the same sampling collector so the full trace stays together. From there, the tail sampler applies two rules:
- Keep Error Traces: Using an OpenTelemetry Transformation Language (OTTL) condition, any trace with an ERROR status is kept, as long as trace error persistence is enabled.
- Sample Routine Traces: The remaining traces are sampled at the configured ratio.
- name: keep-errors
  type: and
  and:
    and_sub_policy:
      - name: errors-enabled-gate
        type: ottl_condition
        ottl_condition:
          error_mode: ignore
          span:
            - '"${env:TRACES_PERSIST_ERRORS}" == "true"'
      - name: is-error-status
        type: status_code
        status_code:
          status_codes: [ERROR]
- name: ratio_mode_policy
  type: probabilistic
  probabilistic:
    sampling_percentage: ${env:TRACES_RATIO_NUMBER}
(Note: in the reference architecture, the trace collector defaults to replicas: 0 to save resources when only log pipelines are active. Argo CD annotations make sure this scaled-to-zero state isn't flagged as a degraded Application.)
Security, Least Privilege, and Validation
Octant Clarity keeps permissions as narrow as possible. Collectors reach downstream destinations through a standard Kubernetes Opaque Secret, and Octant's own access to the cluster is limited to a tightly scoped and localized RoleBinding:
rules:
  - apiGroups: [""]
    resources: ["secrets"]
    verbs: ["get"]
    resourceNames: ["greptimedb-users-auth"]
  - apiGroups: ["apps"]
    resources: ["deployments"]
    verbs: ["get"]
    resourceNames: ["test-dd-log-sampling-collector", "test-dd-trace-sampling-collector"]
To confirm telemetry is actually flowing correctly, a TelemetryValidation custom resource runs fidelity checks — not a generic health check, but a validation scoped to one specific collector and one specific run ID.
Measuring True Reduction: The MdaiObserver
A configured sampling ratio is an input — not an outcome. It is not the same as the actual reduction you get, because error persistence adds extra records on top of the routine sampling ratio. So your real, observed data reduction will almost always differ from your configured baseline.
The custom resource, MdaiObserver, tracks telemetry as it enters and leaves the pipeline, tagging each measurement as received or exported. It attaches an observer_direction attribute. That gives you per-service metrics like:
items_received_by_service_totalitems_sent_by_service_totalbytes_received_by_service_totalbytes_sent_by_service_total
For example: if your log ratio is set to 25% and you send in 10GB of logs, but only 2.8GB comes out the other end, your real observed reduction is 72% — not the 75% the ratio alone would suggest. That extra 0.3GB is the error telemetry being preserved. Because the observer separates "configured ratio" from "actual volume reduction," you can tune your policy based on real network flow instead of guesswork.
Getting Clarity
Octant Clarity gives you a free, open-source way to govern telemetry through declarative, Git-tracked policy — with immediate, measurable improvements to your data pipeline at no cost. If you later need multi-cluster fleet management, deeper RBAC controls, or dedicated enterprise support, Octant's managed enterprise tiers build on this same open-source foundation.
Get started for free with Octant Clarity.
For enterprises, our transparent pricing is available on the Octant pricing page.
Component reference
| Resource | Role |
|---|---|
| Argo CD Application | Deploys the solution from a source-controlled path into the cluster |
| MyDecisive platform Application | Installs the MyDecisive (mdai-hub) platform chart |
| MdaiHub | Holds the four sampling and error-persistence variables |
| Connection / load-balancing collector | Normalizes incoming telemetry and routes it to the right sampling collector |
| Log-sampling collector | Applies the log ratio and log error persistence |
| Trace-sampling collector | Applies the trace ratio and trace error persistence via tail sampling |
| MdaiObserver | Measures received vs. exported volume |
| TelemetryValidation | Validates one collector's fidelity for one run |
| Destination integration secret | Holds the credentials collectors use to reach the downstream destination |
| Octant access controls | Scopes Octant's own read access to the cluster |
Learn more in our GitHub project.
Join our Slack community, ask questions, and vote for more posts like this one. We can walk you through building your own pipelines and applets in MyDecisive. We are, after all, open source.


